GeoBench TreeSatAI#
Intro#
TreeSatAI Ahlswede et al. 2023 is a comprehensive dataset for forest species classification using multi-temporal Sentinel-2 satellite imagery. The dataset provides time series of optical imagery with detailed forest inventory annotations, enabling automated tree species identification and forest monitoring across diverse European forest ecosystems. It addresses the critical challenge of large-scale forest species mapping for biodiversity assessment, forest management, and ecological monitoring applications. We use the version provided by Labatie et al. 2025.
Dataset Characteristics#
Modalities:
Multi-temporal Sentinel-2 optical imagery
Spatial Resolution: 10m (resampled from native Sentinel-2 bands)
Temporal Resolution: Monthly time series across growing seasons
Spectral Bands:
S2: 10 bands (B02, B03, B04, B05, B06, B07, B08, B8A, B11, B12)
Image Dimensions: 32x32 pixels per patch (forest stand level)
Labels: Tree species classification
13 major European tree species
Including deciduous and coniferous species
Geographic Distribution: France (comprehensive forest coverage)
Temporal Coverage: Multi-year time series (2018-2020)
Forest Types: Diverse European forest ecosystems
GeoBenchV2 Processing Pipeline#
Preprocessing Steps#
Split Generation:
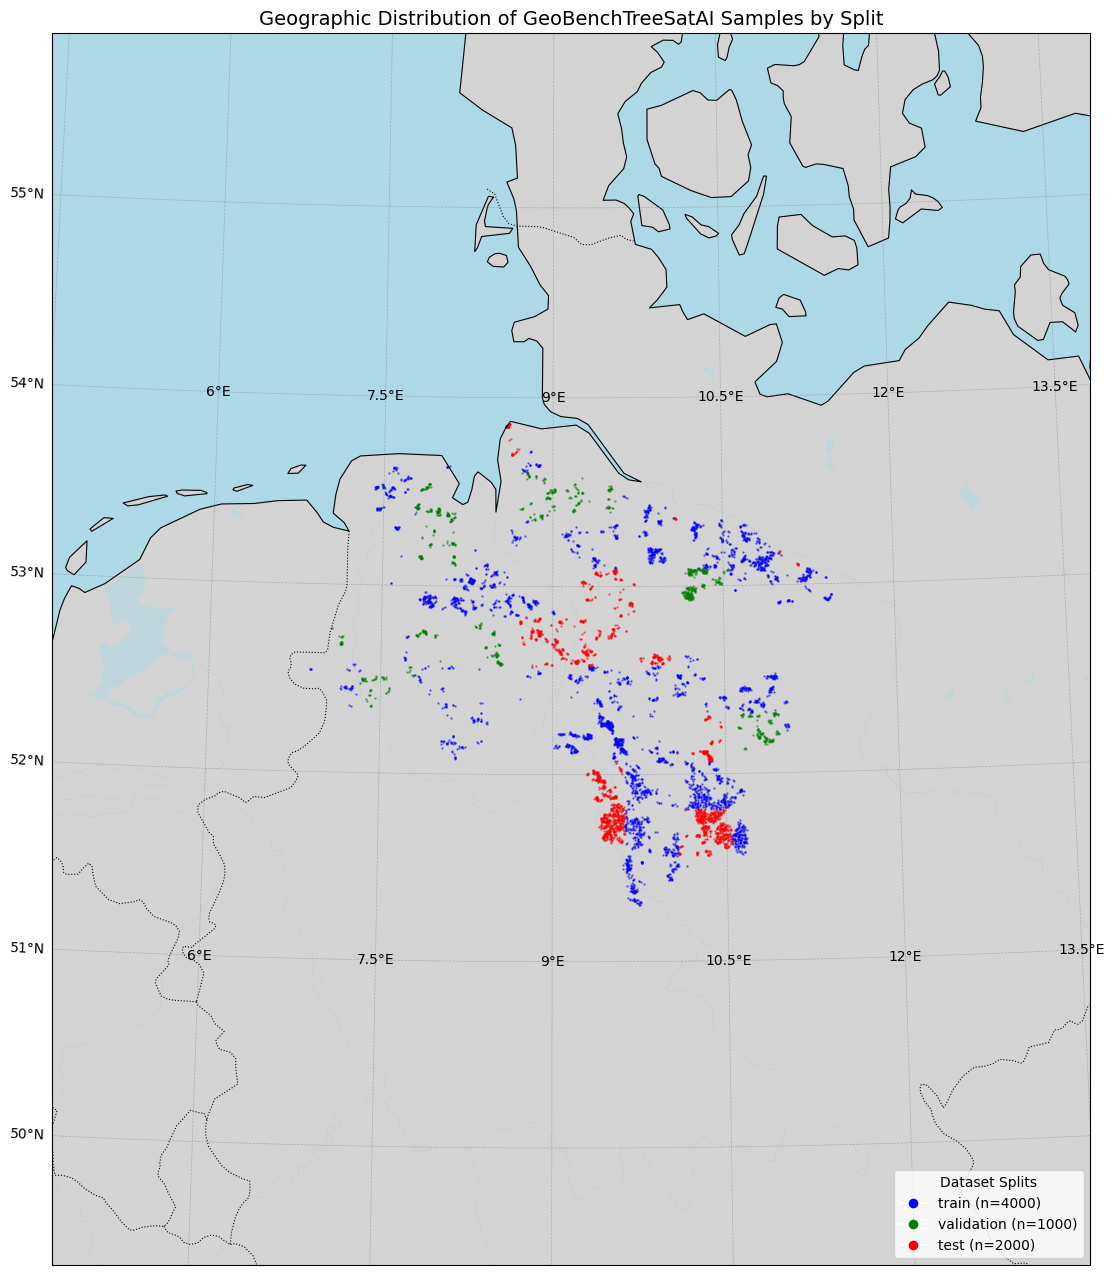
Use a 10x10 grid over the sample region and assign samples within each grid block to one of train, validation or test such that we roughly obtain a 70-20-10 distribution
Label Processing#
13-Class Species Classification: Comprehensive European tree species identification
References#
Ahlswede, S., Schulz, C., Gava, C., Helber, P., Bischke, B., Förster, M., … & Kleinschmit, B. (2023). TreeSatAI Benchmark Archive: A multi-sensor, multi-label dataset for tree species classification in remote sensing. Earth System Science Data, 15(2), 681-695.
TreeSatAI Dataset: https://huggingface.co/datasets/IGNF/TreeSatAI-Time-Series
[1]:
import os
from pathlib import Path

import torch

from geobench_v2.datamodules import GeoBenchTreeSatAIDataModule
from geobench_v2.datasets.normalization import SatMAENormalizer, ZScoreNormalizer
from geobench_v2.datasets.visualization_util import (
    compare_normalization_methods,
    compute_batch_histograms,
    plot_batch_histograms,
    plot_channel_histograms,
)

%load_ext autoreload
%autoreload 2
[2]:
DATA_ROOT = Path("../../data/treesatai")

STATS_SATMAE_PATH = os.path.join(DATA_ROOT, "treesatai_stats_satmae.json")
STATS_CLIP_RESCALE_PATH = os.path.join(DATA_ROOT, "treesatai_stats_clip_rescale.json")
[3]:
band_order = {"aerial": ["red", "green", "blue", "nir"]}

datamodule = GeoBenchTreeSatAIDataModule(
    img_size=120,
    batch_size=4,
    num_workers=4,
    root=DATA_ROOT,
    band_order=band_order,
    data_normalizer=torch.nn.Identity(),  # we do custom normalization in the tutorial
)
datamodule.setup("fit")
Using provided pre-initialized normalizer instance: Identity
Using provided pre-initialized normalizer instance: Identity
[4]:
sample_dist_fig = datamodule.visualize_geospatial_distribution()
Dataset Statistics#
Computed over the training dataset.
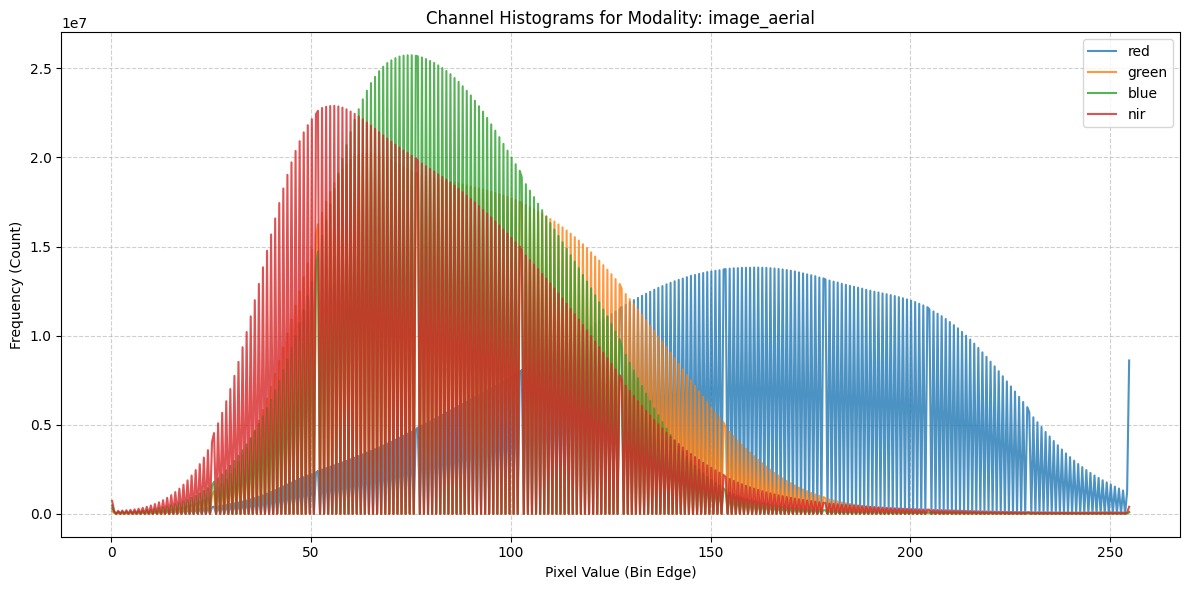
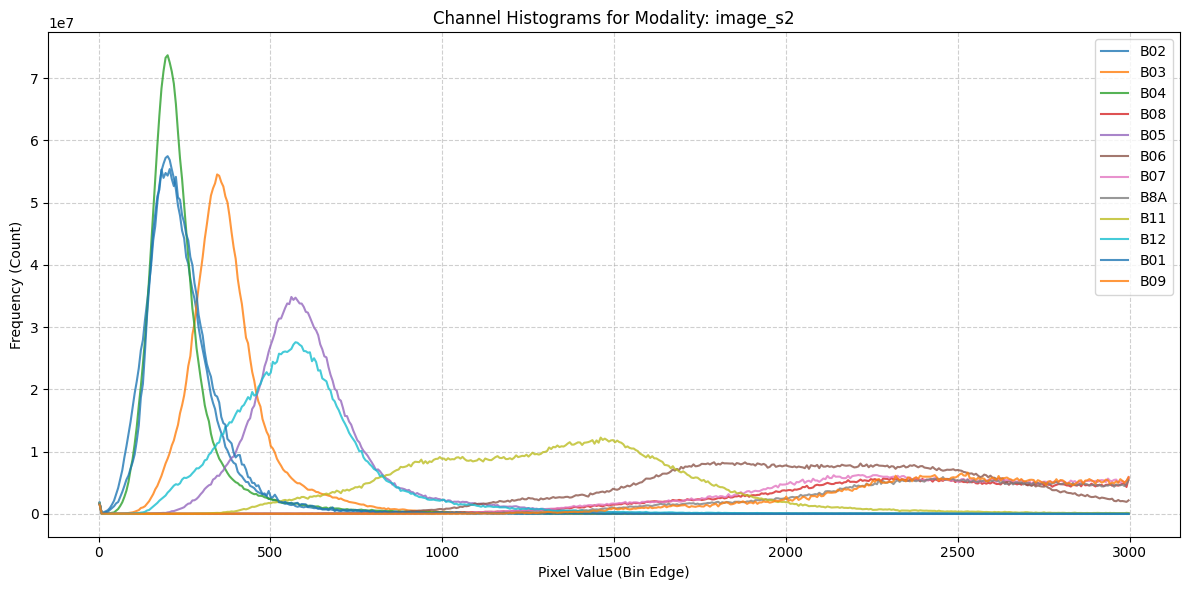
Image Statistics#
[5]:
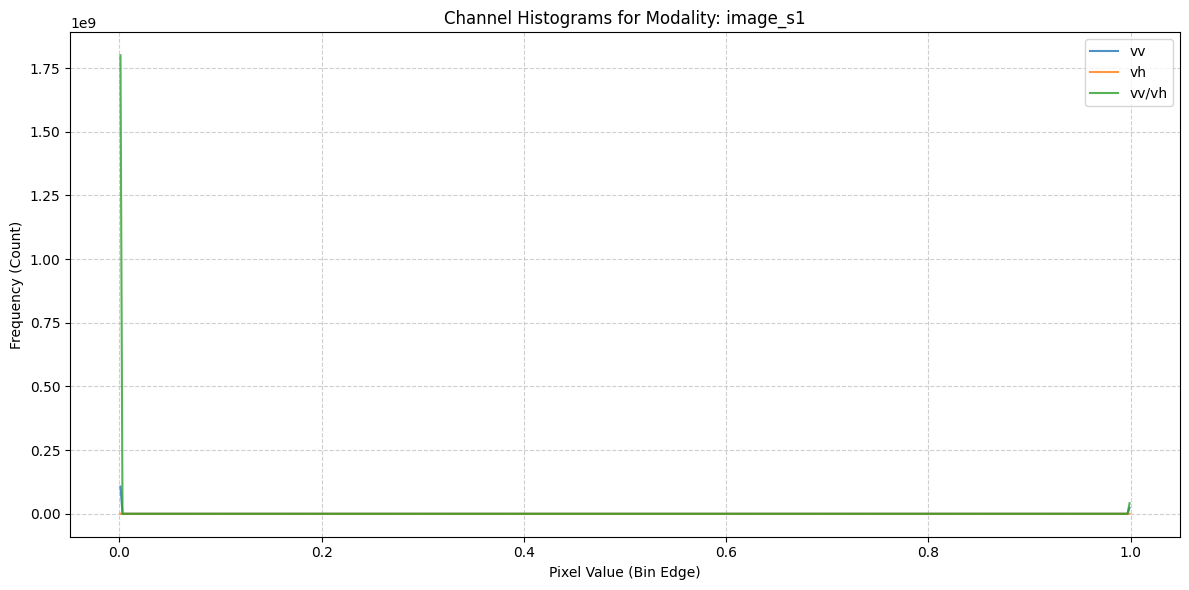
fig = plot_channel_histograms(STATS_SATMAE_PATH)
Target Statistics#
Raw Batch Image Statistics#
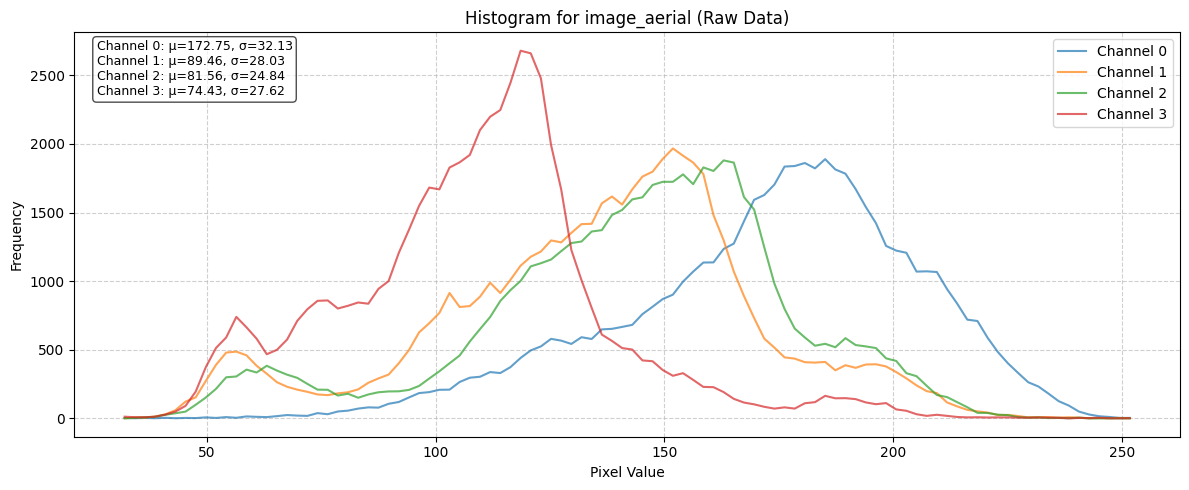
Statistics of a single batch before any normalization
[6]:
# Get a batch of data from the dataloader
train_dataloader = datamodule.train_dataloader()
raw_batch = next(iter(train_dataloader))

raw_batch_stats = compute_batch_histograms(raw_batch, n_bins=100)


raw_figs = plot_batch_histograms(
    raw_batch_stats, band_order, title_suffix=" (Raw Data)"
)
Effect of different Normalization Schemes#
[7]:
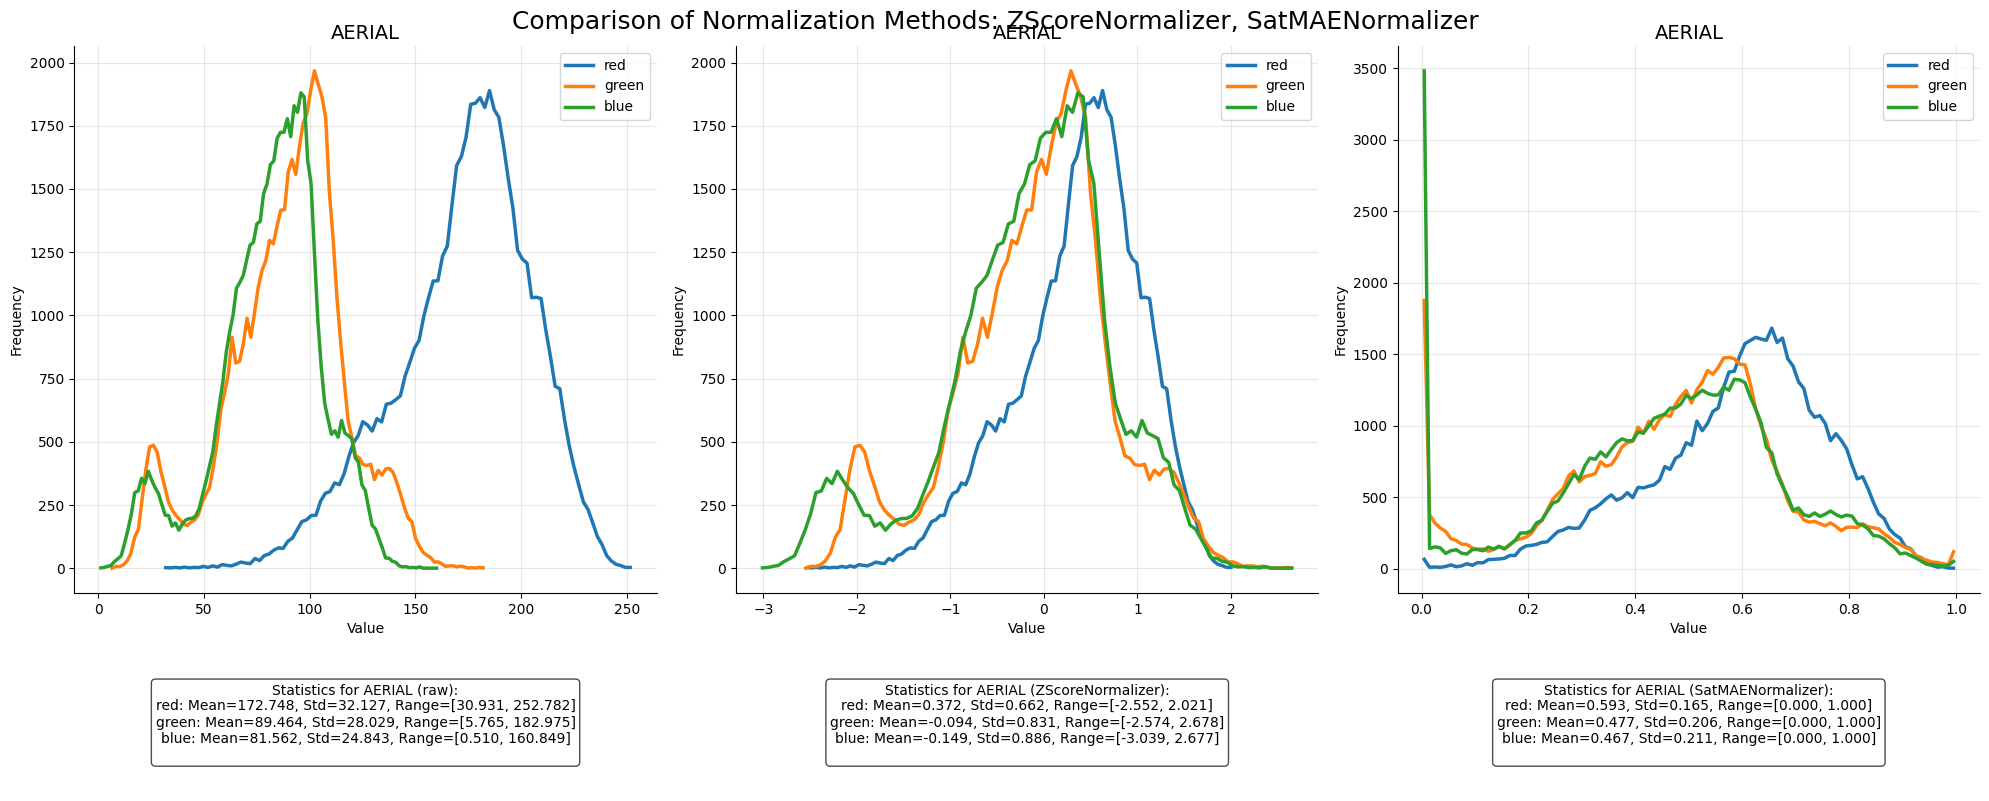
zscore_normalizer = ZScoreNormalizer(STATS_CLIP_RESCALE_PATH, band_order)
satmae_normalizer = SatMAENormalizer(STATS_SATMAE_PATH, band_order)
[8]:
norm_fig, normalized_batches = compare_normalization_methods(
    raw_batch, [zscore_normalizer, satmae_normalizer], datamodule
)
Visualize Batch of data with labels#
[9]:
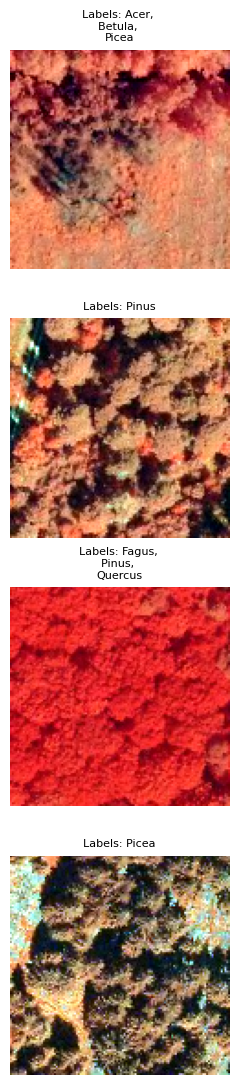
fig, batch = datamodule.visualize_batch()