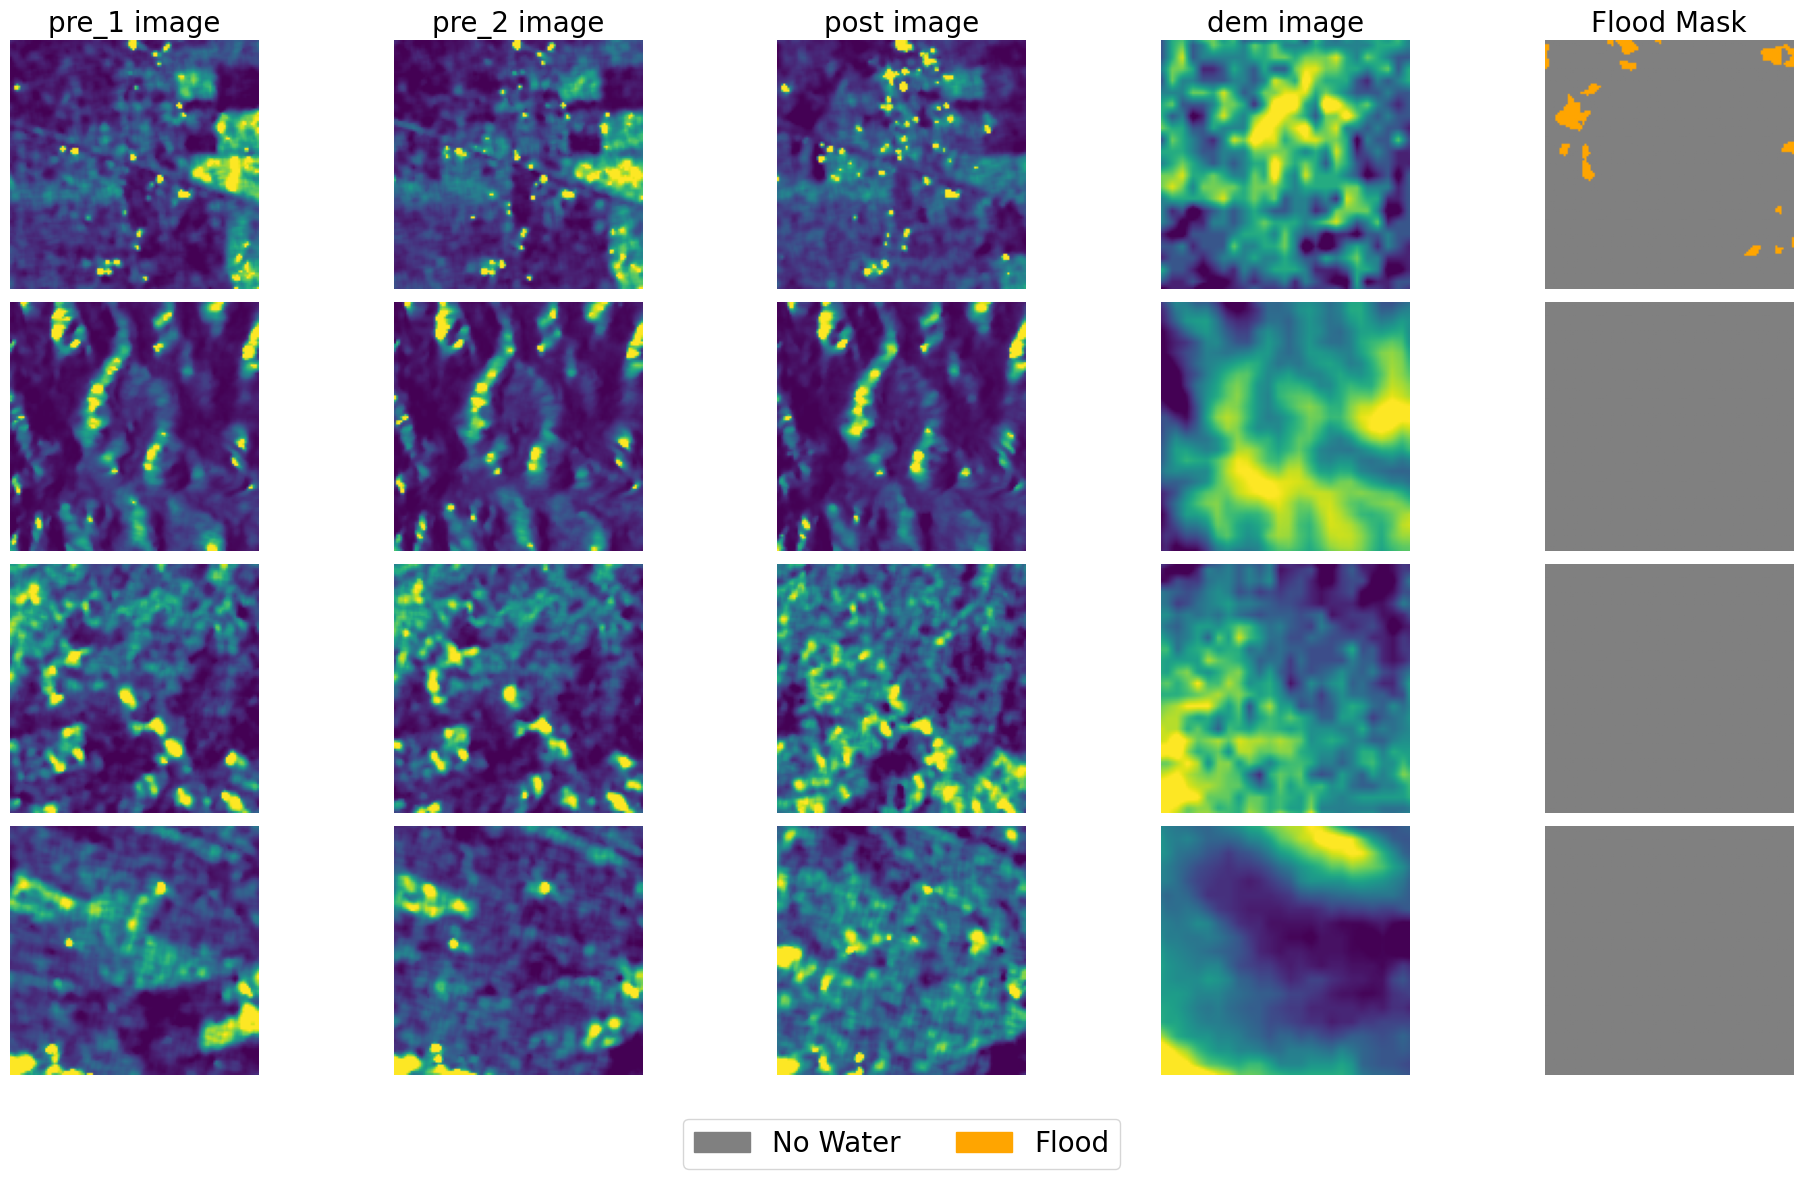
GeoBench KuroSiwo#
Intro#
KuroSiwo (Bountos et al. 2024) is a comprehensive multi-temporal satellite dataset designed for rapid flood detection and monitoring using Synthetic Aperture Radar (SAR) imagery. The dataset combines SAR Ground Range Detected products with Single Look Complex data featuring minimal preprocessing, enabling researchers to leverage both phase and amplitude information for downstream flood mapping applications and algorithm development.
Dataset Characteristics#
Modalities:
Sentinel-1 SAR imagery (VV and VH polarizations)
Digital Elevation Model (DEM) auxiliary data
Slope auxiliary data derived from DEM
Spatial Resolution: 10m ground sample distance
Temporal Resolution: Multi-temporal observations (pre-event, event, post-event)
Spectral Bands:
SAR VV polarization
SAR VH polarization
Image Dimensions: Variable patch sizes (typically 256x256 to 512x512 pixels)
Labels: 4-class flood segmentation masks
Class 0: No-Water
Class 1: Permanent Water
Class 2: Flood Water
Class 3: Invalid/No-dat
Geographic Distribution: Multiple Areas of Interest (AOIs) across different flood-prone regions
GeoBenchV2 Processing Pipeline#
Preprocessing Steps#
Split Generation:
Use referenced train/val/test splits from the original dataset
Dataset Subsampling:
The final version consists of
4,000 training samples
1,000 validation samples
2,000 test samples
References#
Bountos, N.I., Sdraka, M., Zavras, A., Karavias, A., Karasante, I., Herekakis, T., Thanasou, A., Michail, D. and Papoutsis, I., 2024. Kuro Siwo: 33 billion $ m^ 2$ under the water. A global multi-temporal satellite dataset for rapid flood mapping. Advances in Neural Information Processing Systems, 37, pp.38105-38121. https://proceedings.neurips.cc/paper_files/paper/2024/hash/43612b0662cb6a4986edf859fd6ebafe-Abstract-Datasets_and_Benchmarks_Track.html
[1]:
import os
from pathlib import Path

import torch

from geobench_v2.datamodules import GeoBenchKuroSiwoDataModule
from geobench_v2.datasets import GeoBenchKuroSiwo
from geobench_v2.datasets.normalization import SatMAENormalizer, ZScoreNormalizer
from geobench_v2.datasets.visualization_util import (
    compare_normalization_methods,
    compute_batch_histograms,
    plot_batch_histograms,
    plot_channel_histograms,
)

%load_ext autoreload
%autoreload 2
[2]:
DATA_ROOT = Path("../../data/kuro_siwo")

STATS_SATMAE_PATH = os.path.join(DATA_ROOT, "kuro_siwo_stats_satmae.json")
STATS_CLIP_RESCALE_PATH = os.path.join(DATA_ROOT, "kuro_siwo_stats_clip_rescale.json")
[3]:
# band_order = {"s2": ["B04", "B03", "B02"], "s1": ["VV", "VH"]}
band_order = GeoBenchKuroSiwo.band_default_order

datamodule = GeoBenchKuroSiwoDataModule(
    img_size=120,
    batch_size=4,
    num_workers=4,
    root=DATA_ROOT,
    band_order=band_order,
    data_normalizer=torch.nn.Identity(),  # we do custom normalization in the tutorial
)
datamodule.setup("fit")
Using provided pre-initialized normalizer instance: Identity
Using provided pre-initialized normalizer instance: Identity
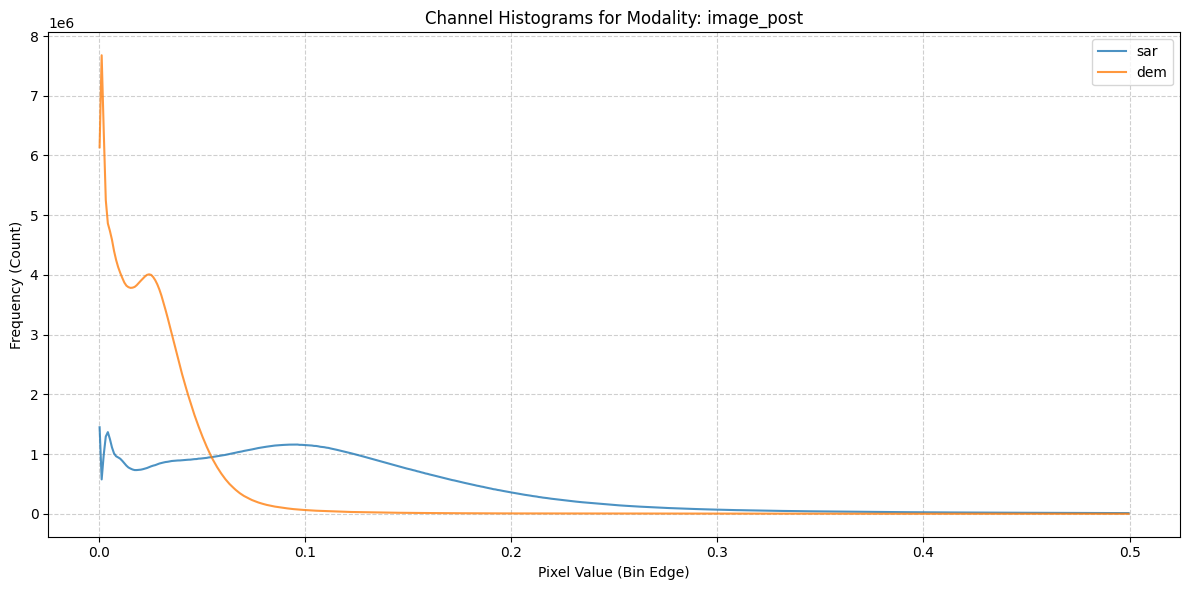
Raw Image Statistics#
Computed over the training dataset.
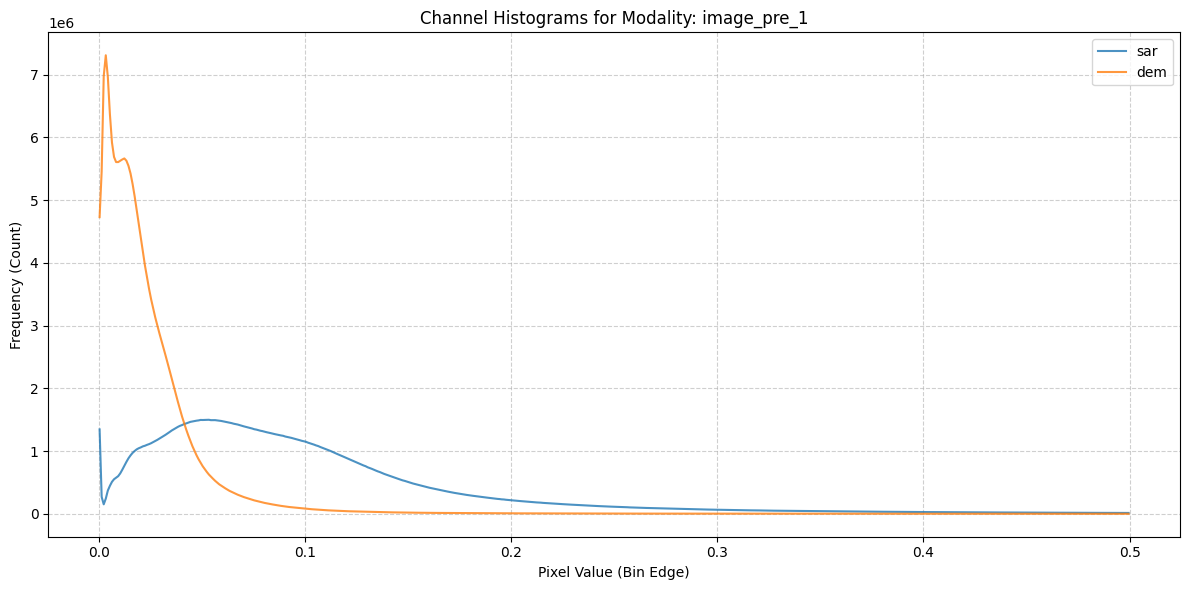
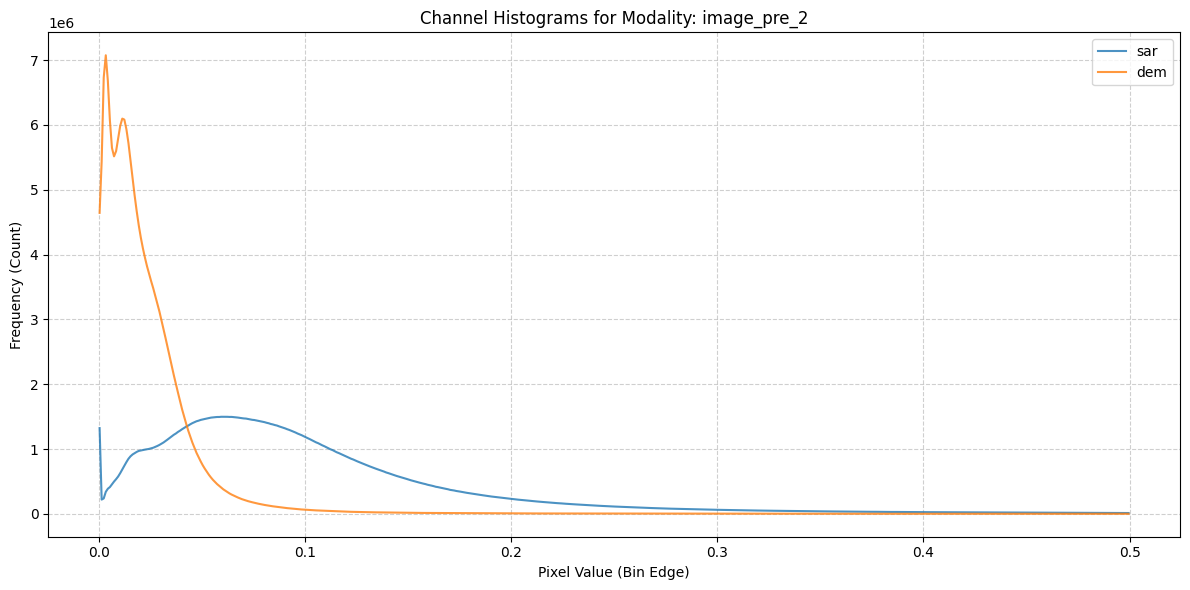
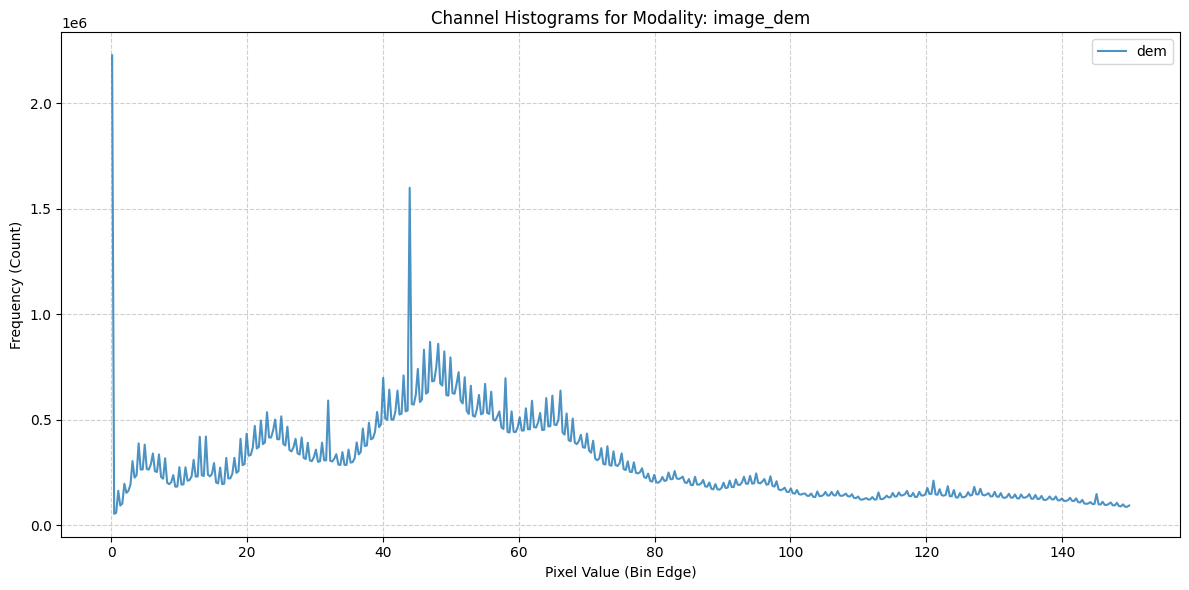
[4]:
fig = plot_channel_histograms(STATS_SATMAE_PATH)
Raw Batch Statistics#
[5]:
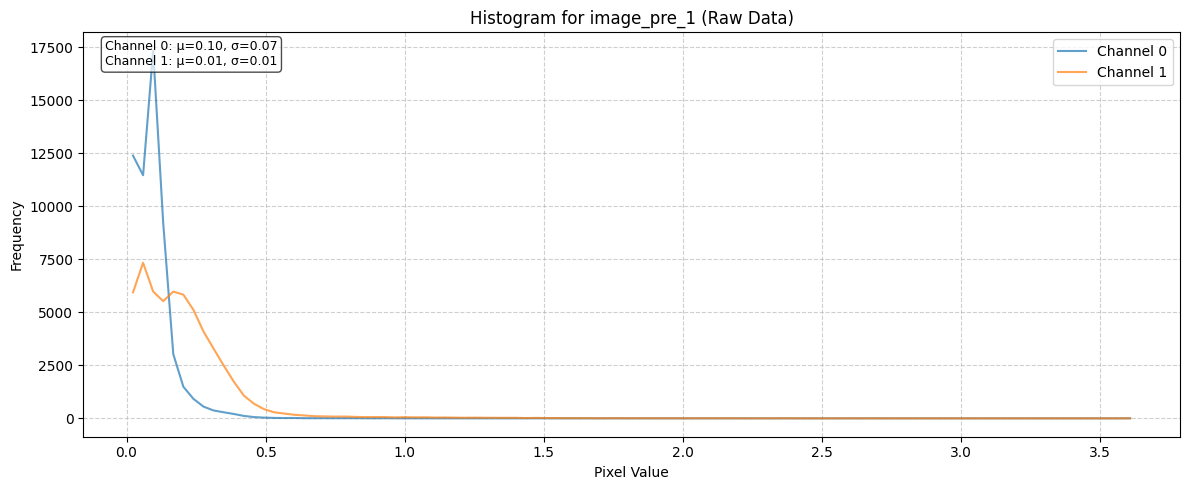
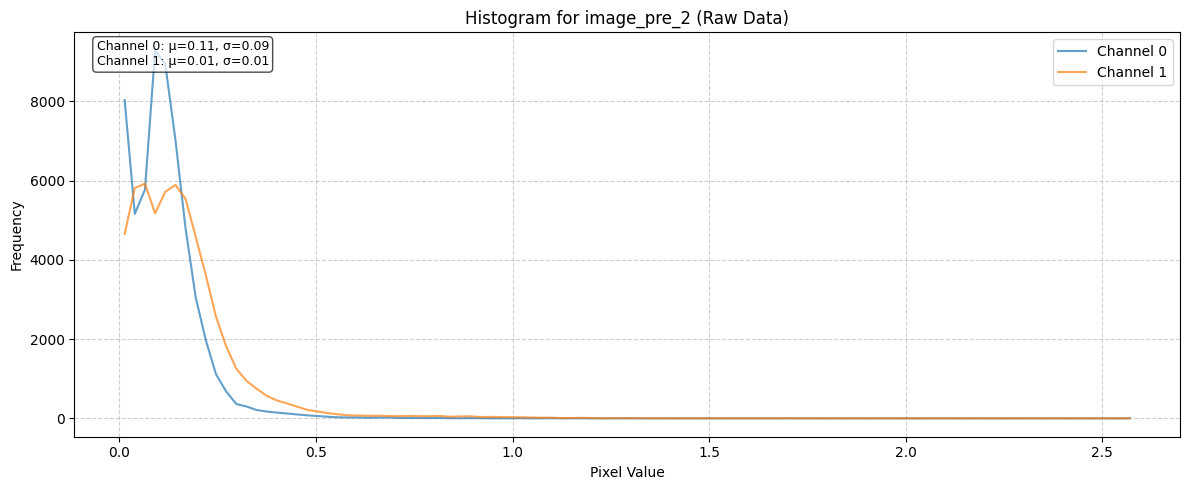
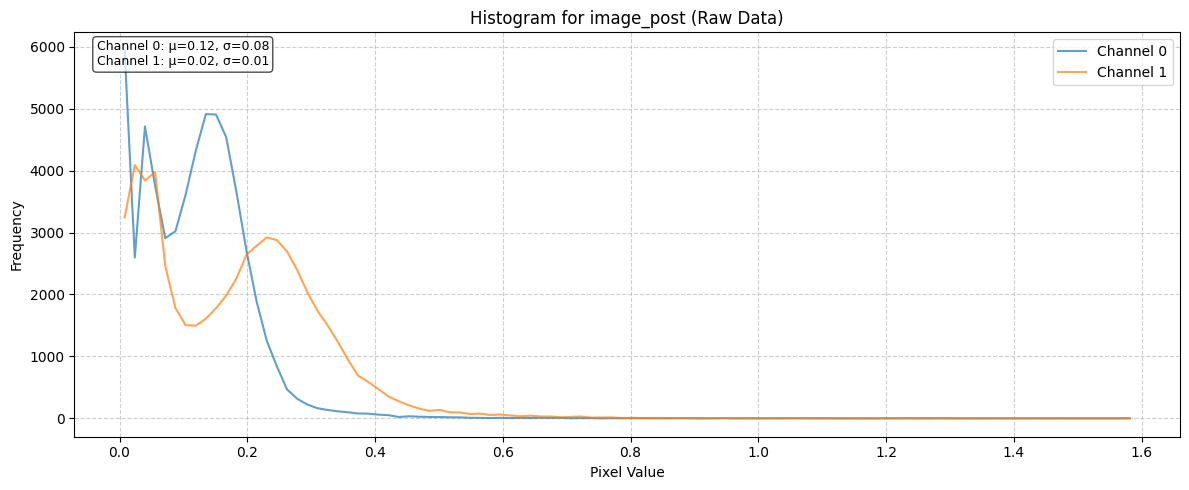
# Get a batch of data from the dataloader
train_dataloader = datamodule.train_dataloader()
raw_batch = next(iter(train_dataloader))

raw_batch_stats = compute_batch_histograms(raw_batch, n_bins=100)


raw_figs = plot_batch_histograms(
    raw_batch_stats, band_order, title_suffix=" (Raw Data)"
)
raw_figs
[5]:
[<Figure size 1200x500 with 1 Axes>,
 <Figure size 1200x500 with 1 Axes>,
 <Figure size 1200x500 with 1 Axes>,
 <Figure size 1200x500 with 1 Axes>]
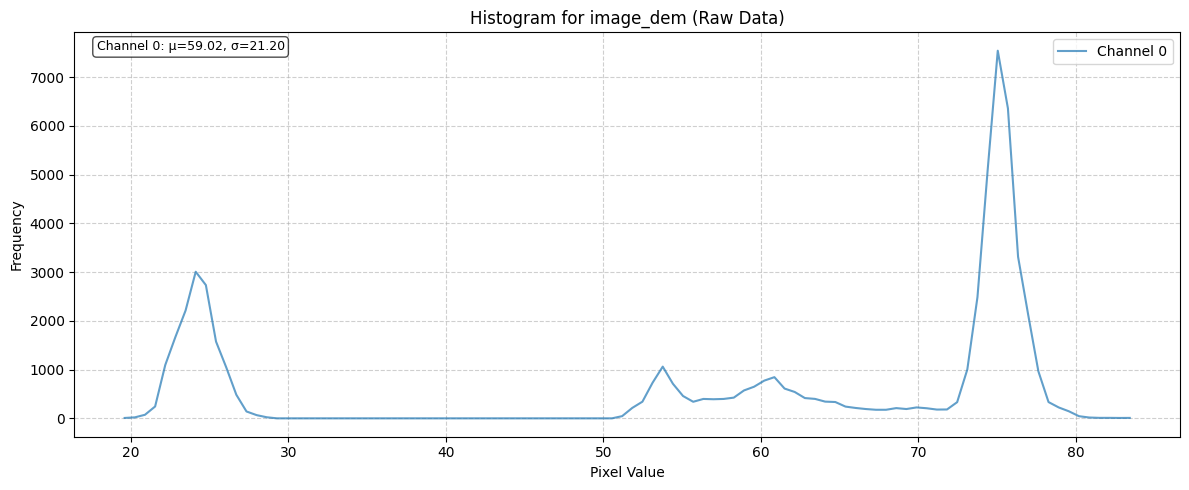
Effect of Normalization Schemes#
[6]:
zscore_normalizer = ZScoreNormalizer(STATS_CLIP_RESCALE_PATH, band_order)
satmae_normalizer = SatMAENormalizer(STATS_SATMAE_PATH, band_order)
---------------------------------------------------------------------------
ValueError                                Traceback (most recent call last)
Cell In[6], line 1
----> 1 zscore_normalizer = ZScoreNormalizer(STATS_CLIP_RESCALE_PATH, band_order)
      2 satmae_normalizer = SatMAENormalizer(STATS_SATMAE_PATH, band_order)

File ~/projects/GEO-Bench-2/geobench_v2/datasets/normalization.py:530, in ZScoreNormalizer.__init__(self, stats, band_order, image_keys)
    517 def __init__(
    518     self,
    519     stats: dict[str, dict[str, float]] | Path,
    520     band_order: list[str | float] | dict[str, list[str | float]],
    521     image_keys: Sequence[str] | None = None,
    522 ) -> None:
    523     """Initialize z-score normalizer.
    524
    525     Args:
   (...)    528         image_keys: Keys to normalize in data dict
    529     """
--> 530     super().__init__(stats, band_order, image_keys)

File ~/projects/GEO-Bench-2/geobench_v2/datasets/normalization.py:98, in DataNormalizer.__init__(self, stats, band_order, image_keys)
     95 self.stds: dict[str, Tensor] = {}
     96 self.is_fill_value: dict[str, Tensor] = {}
---> 98 self._initialize_statistics()

File ~/projects/GEO-Bench-2/geobench_v2/datasets/normalization.py:110, in DataNormalizer._initialize_statistics(self)
    108 if isinstance(self.band_order, dict):
    109     for modality, bands in self.band_order.items():
--> 110         means, stds, is_fill = self._get_band_stats(bands)
    112         base_key = f"image_{modality}"
    113         self.means[base_key] = means

File ~/projects/GEO-Bench-2/geobench_v2/datasets/normalization.py:183, in DataNormalizer._get_band_stats(self, bands)
    179 else:
    180     if band not in self.stats.get(
    181         "means", {}
    182     ) or band not in self.stats.get("stds", {}):
--> 183         raise ValueError(
    184             f"Band '{band}' not found in normalization statistics (means/stds)."
    185         )
    186     means.append(self.stats["means"][band])
    187     stds.append(self.stats["stds"][band])

ValueError: Band 'vv' not found in normalization statistics (means/stds).
[ ]:
norm_fig, normalized_batches = compare_normalization_methods(
    raw_batch, [zscore_normalizer, satmae_normalizer], datamodule
)
Visualize Batch#
[7]:
fig, batch = datamodule.visualize_batch()