GeoBench SpaceNet7#
Intro#
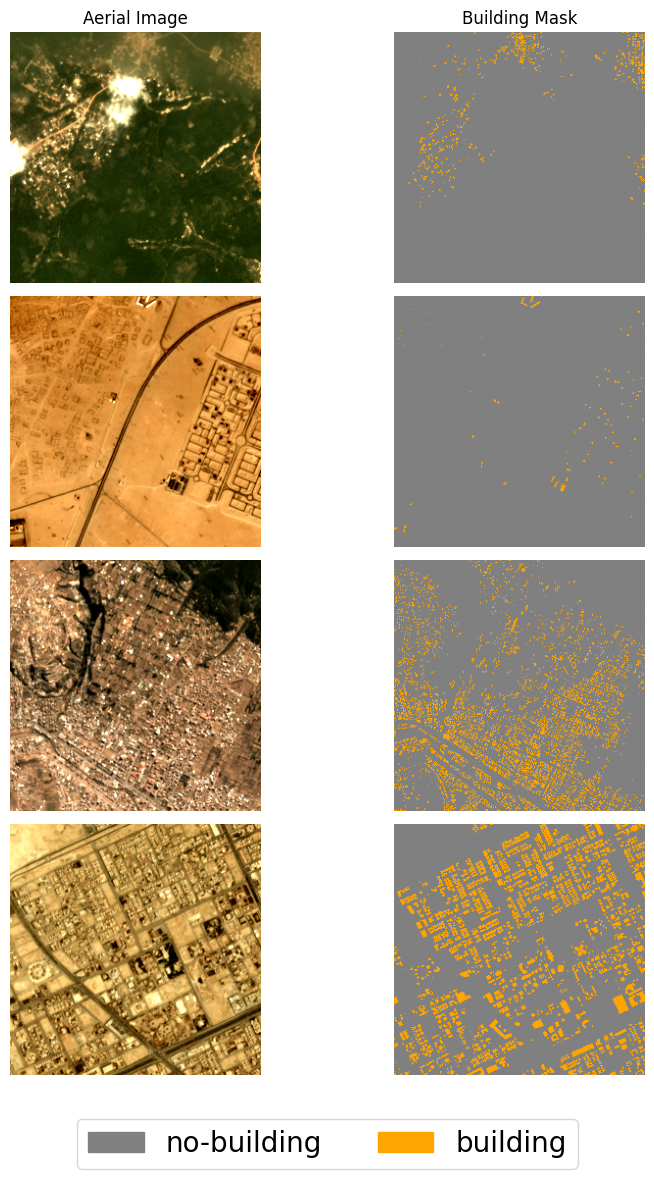
SpaceNet7 (Van Etten et al. 2021) is a multi-temporal building footprint tracking dataset using time-series Planet Dove satellite imagery. The dataset provides monthly time series of high-resolution optical imagery with building footprint annotations, for building detection and tracking over time.
Dataset Characteristics#
Modalities:
Planet satellite imagery
Spatial Resolution: 4m (Planet PlanetScope)
Spectral Bands:
RGB: 3 channels (Red, Green, Blue)
Image Dimensions: 512x512 pixels per patch
Labels:
Binary segmentation (building vs. non-building)
Monthly building status tracking
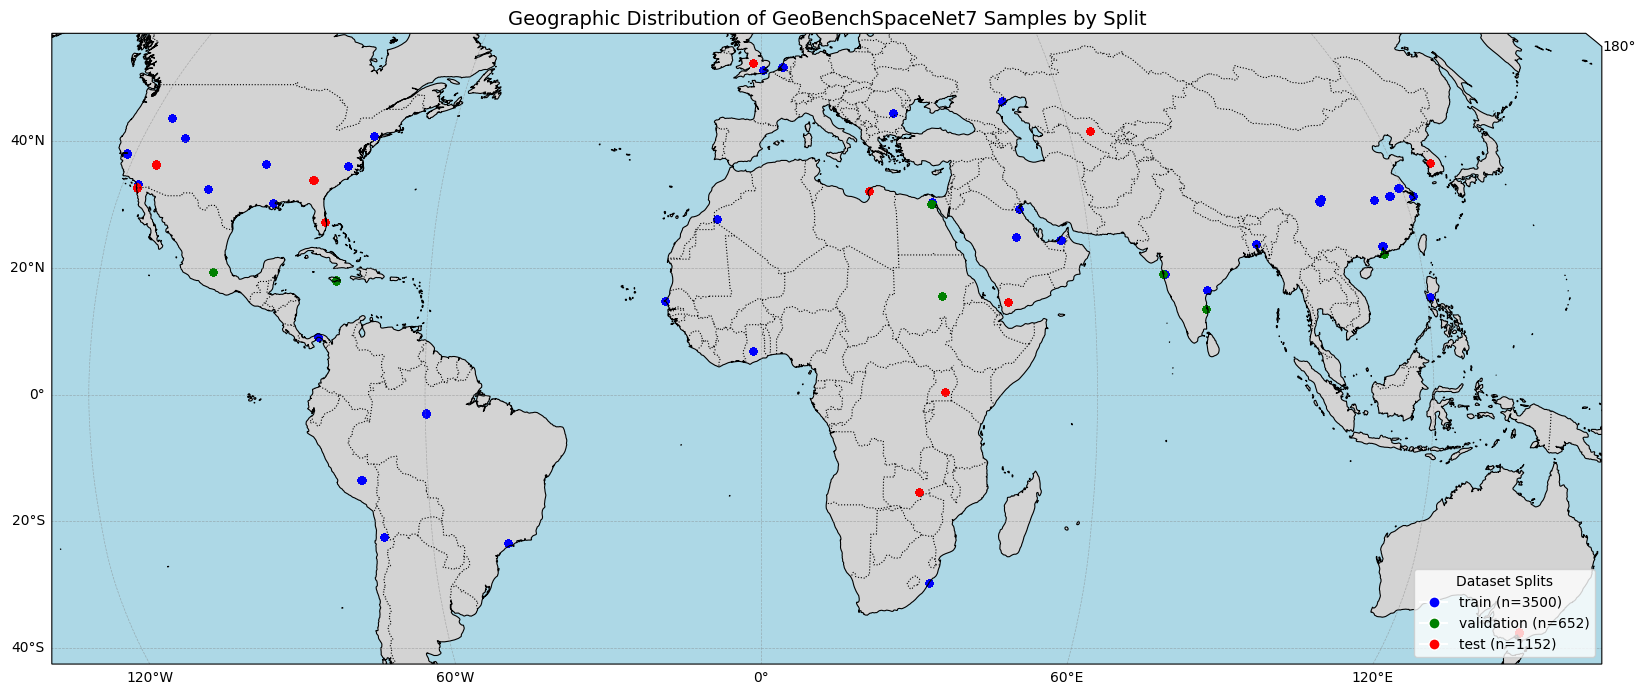
Geographic Distribution: Global coverage (100+ cities)
GeoBenchV2 Processing Pipeline#
Preprocessing Steps#
Patch Generation
The original 1024x1024px tiles are separated into 4 512x512px patches
Split Generation:
train/val/test splits were generated by separating the different areas of interests (AOI) so that the sets are disjoint given the location
References#
Van Etten, A., Hogan, D., Martinez-Manso, J., Shermeyer, J., Weir, N., & Lewis, R. (2021). The multi-temporal urban development SpaceNet dataset. Proceedings of the IEEE/CVF Conference on Computer Vision and Pattern Recognition, 6398-6407..
[1]:
import os
from pathlib import Path

import torch

from geobench_v2.datamodules import GeoBenchSpaceNet7DataModule
from geobench_v2.datasets import GeoBenchSpaceNet7
from geobench_v2.datasets.normalization import SatMAENormalizer, ZScoreNormalizer
from geobench_v2.datasets.visualization_util import (
    compare_normalization_methods,
    compute_batch_histograms,
    plot_batch_histograms,
    plot_channel_histograms,
    visualize_segmentation_target_statistics,
)

%load_ext autoreload
%autoreload 2
[2]:
DATA_ROOT = Path("../../data/spacenet7")

STATS_SATMAE_PATH = os.path.join(DATA_ROOT, "spacenet7_stats_satmae.json")
STATS_CLIP_RESCALE_PATH = os.path.join(DATA_ROOT, "spacenet7_stats_clip_rescale.json")
[3]:
band_order = GeoBenchSpaceNet7.band_default_order

datamodule = GeoBenchSpaceNet7DataModule(
    img_size=256,
    batch_size=4,
    num_workers=4,
    root=DATA_ROOT,
    band_order=band_order,
    data_normalizer=torch.nn.Identity(),  # we do custom normalization in the tutorial
)
datamodule.setup("fit")
Using provided pre-initialized normalizer instance: Identity
Using provided pre-initialized normalizer instance: Identity
[4]:
sample_dist_fig = datamodule.visualize_geospatial_distribution(s=20)
Dataset Statistics#
Image Statistics#
[5]:
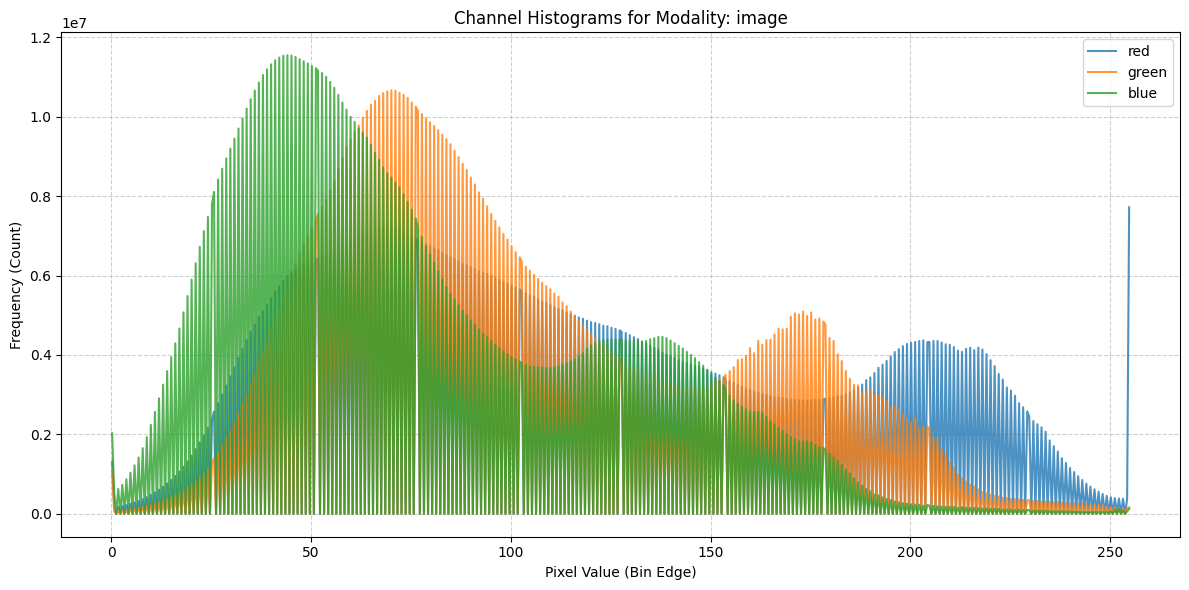
fig = plot_channel_histograms(STATS_SATMAE_PATH)
Target Statistics#
[6]:
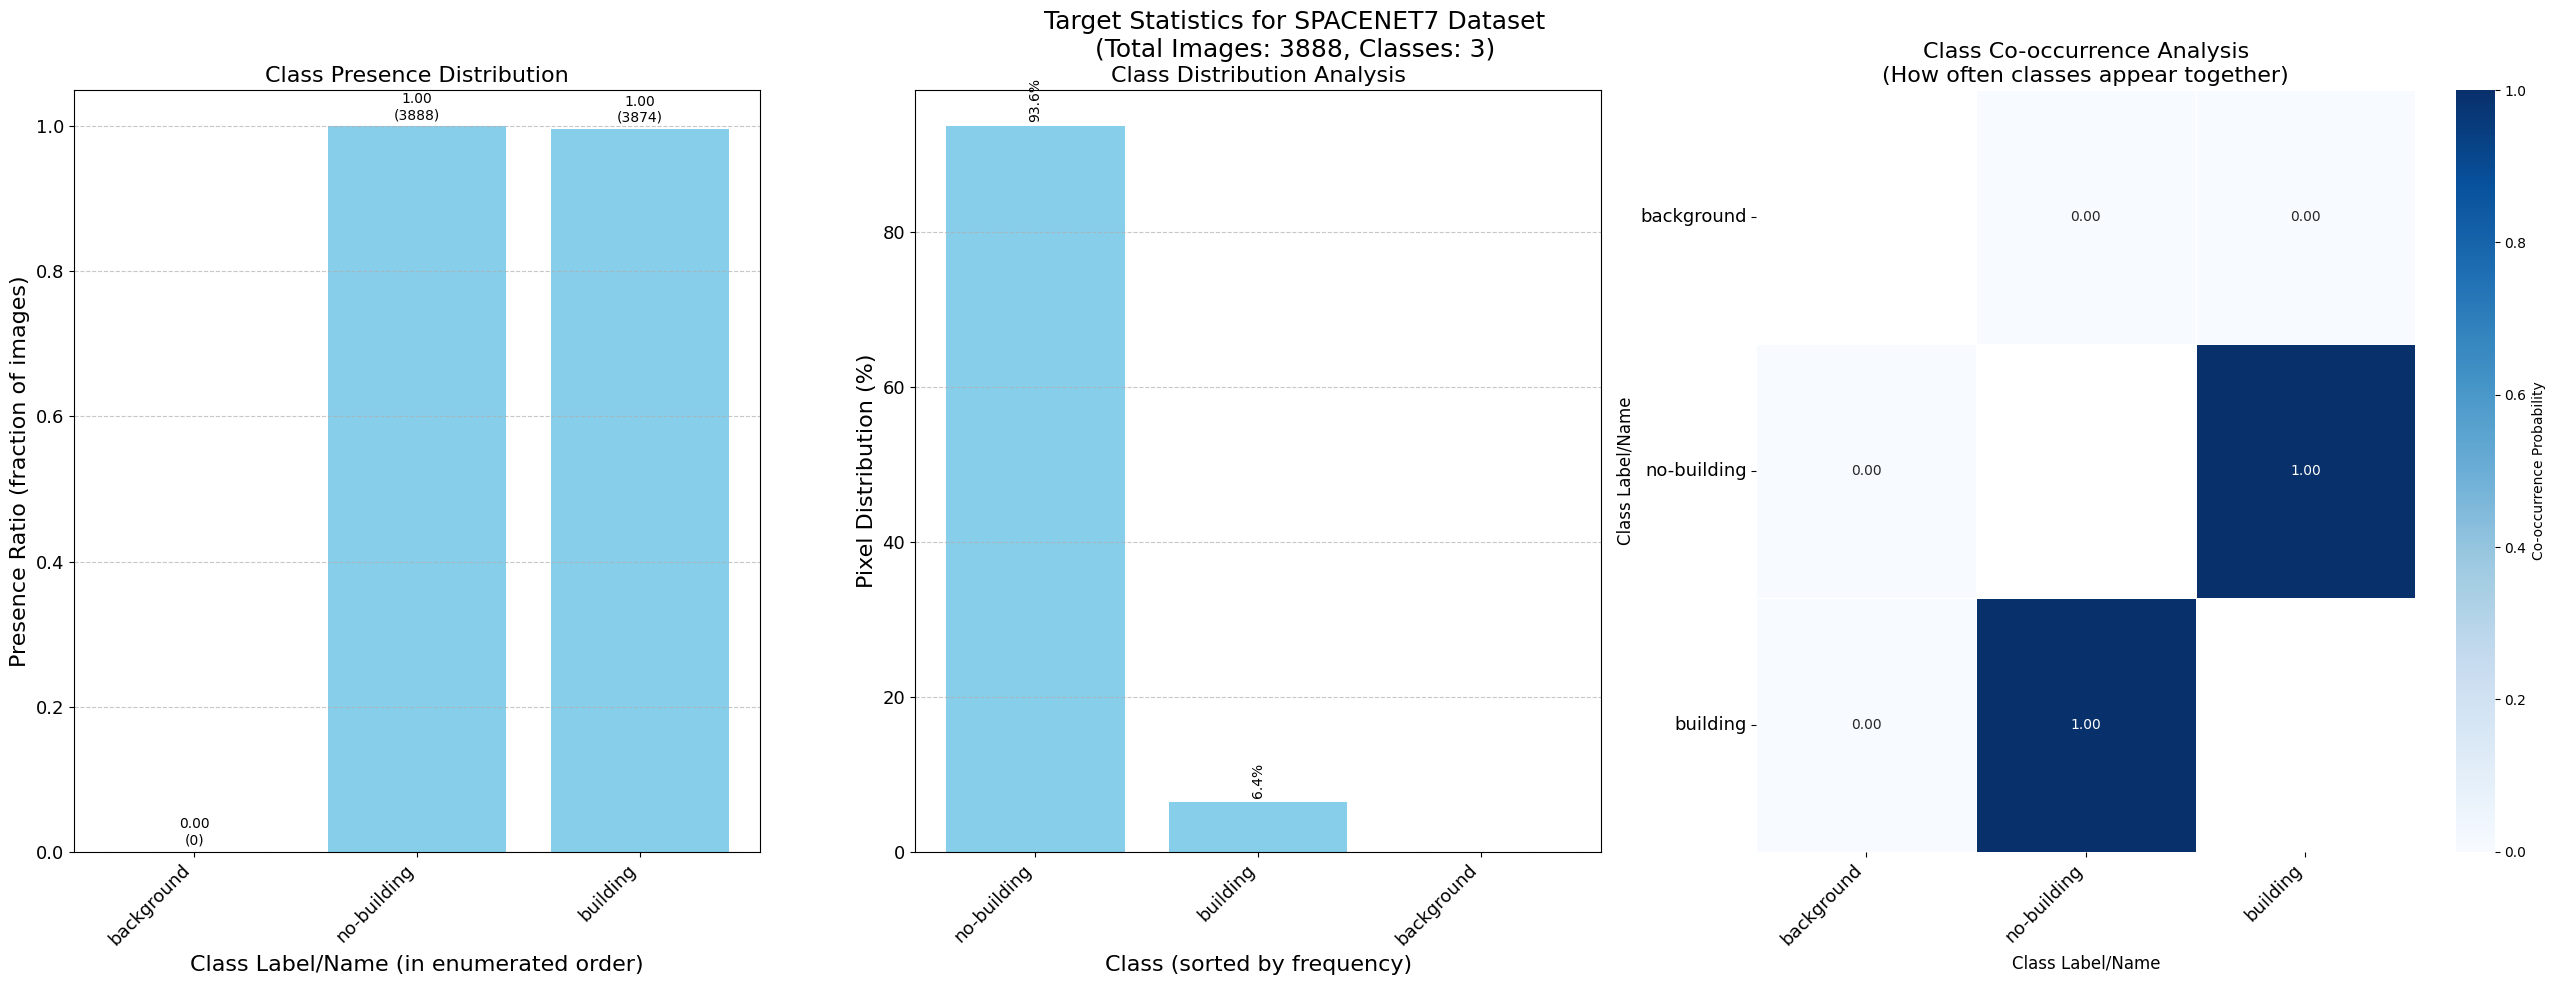
figs = visualize_segmentation_target_statistics(STATS_SATMAE_PATH, "SpaceNet7")
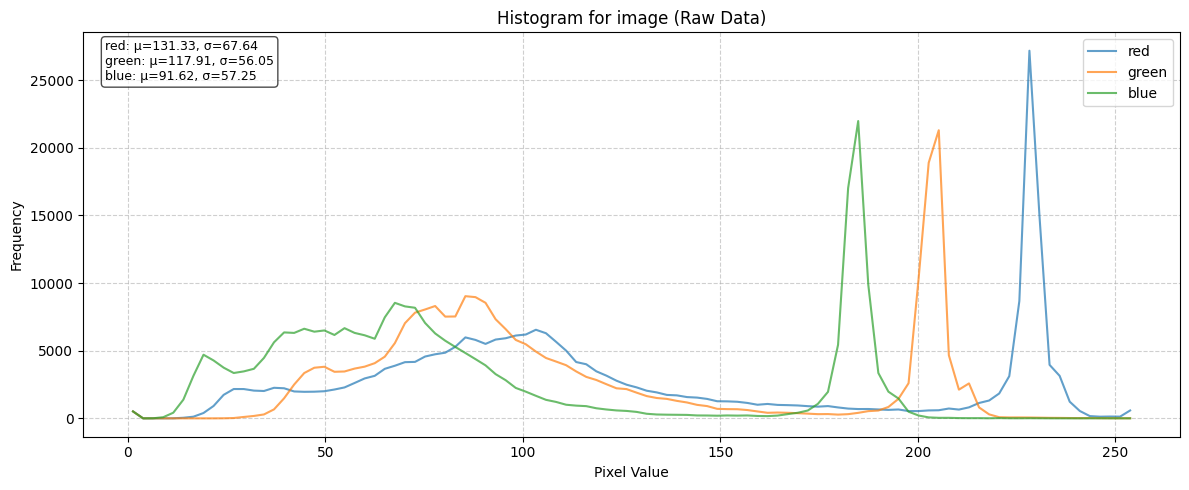
Raw Batch Image Statistics#
Statistics of a single batch before any normalization
[7]:
# Get a batch of data from the dataloader
train_dataloader = datamodule.train_dataloader()
raw_batch = next(iter(train_dataloader))

raw_batch_stats = compute_batch_histograms(raw_batch, n_bins=100)

raw_figs = plot_batch_histograms(
    raw_batch_stats, band_order, title_suffix=" (Raw Data)"
)
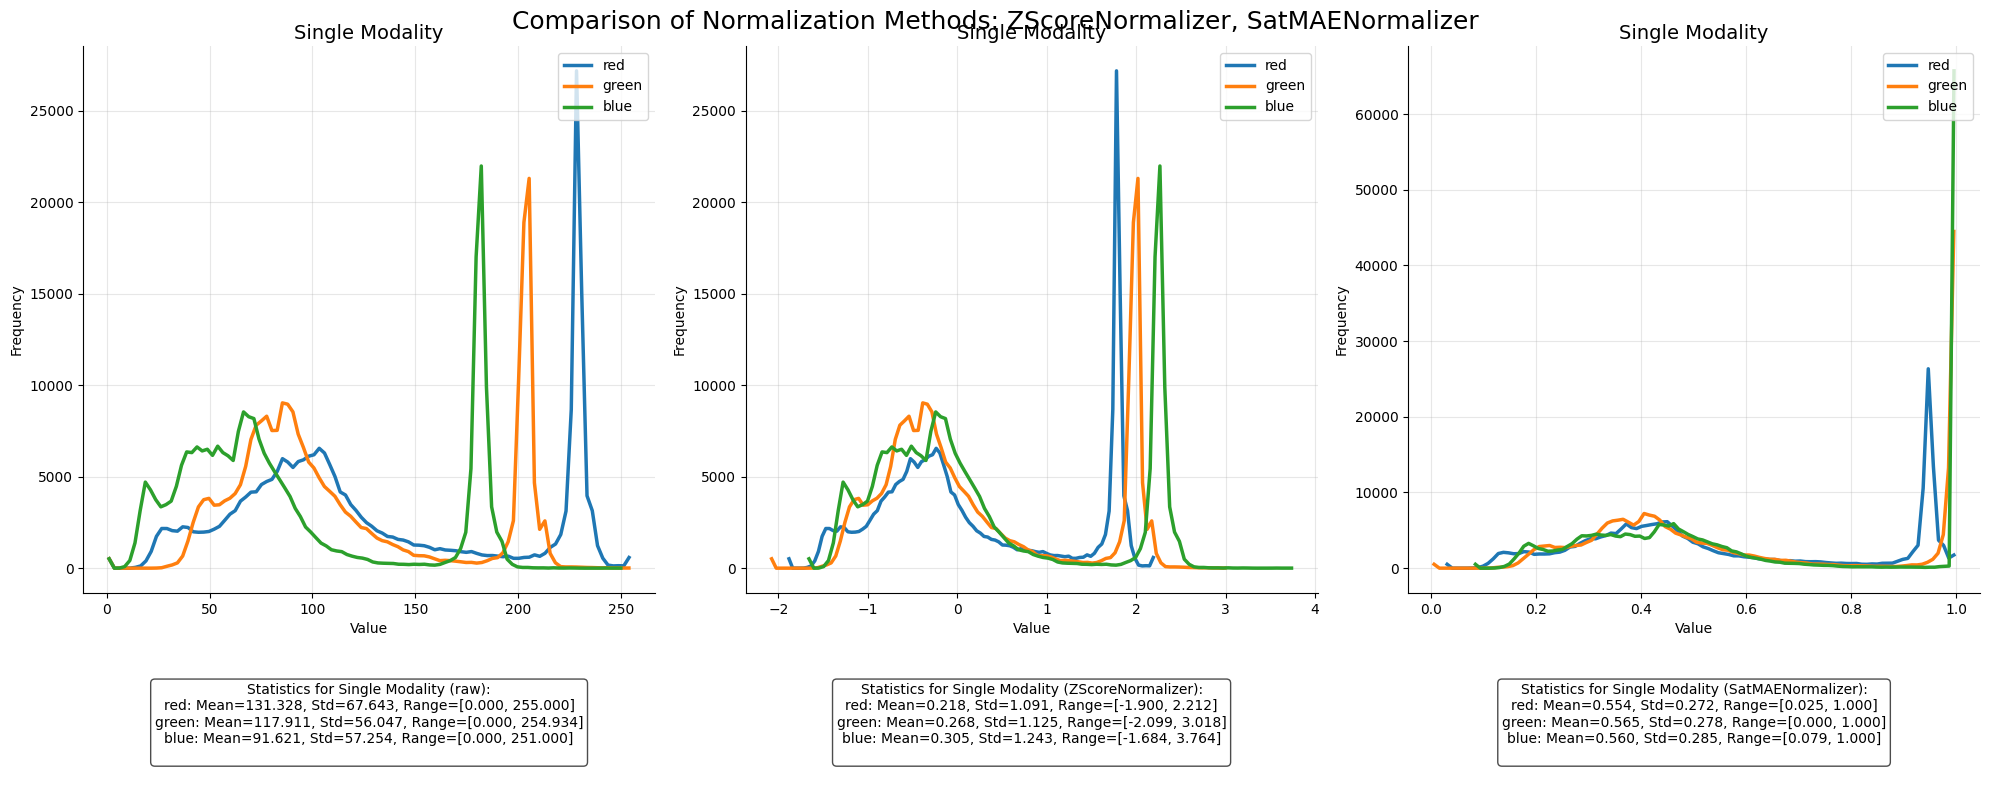
Effect of different Normalization Schemes#
[8]:
zscore_normalizer = ZScoreNormalizer(STATS_CLIP_RESCALE_PATH, band_order)
satmae_normalizer = SatMAENormalizer(STATS_SATMAE_PATH, band_order)
[9]:
norm_fig, normalized_batches = compare_normalization_methods(
    raw_batch, [zscore_normalizer, satmae_normalizer], datamodule
)
Visualize Batch#
[10]:
fig, batch = datamodule.visualize_batch()